
Size of this PNG preview of this SVG file: 522 × 442 pixels. Other resolutions: 284 × 240 pixels | 567 × 480 pixels | 907 × 768 pixels | 1,209 × 1,024 pixels | 2,419 × 2,048 pixels.
Original file (SVG file, nominally 522 × 442 pixels, file size: 44 KB)
![]() ✗
The source code of this SVG is invalid due to 7 errors.
✗
The source code of this SVG is invalid due to 7 errors.
Summary
| Description |
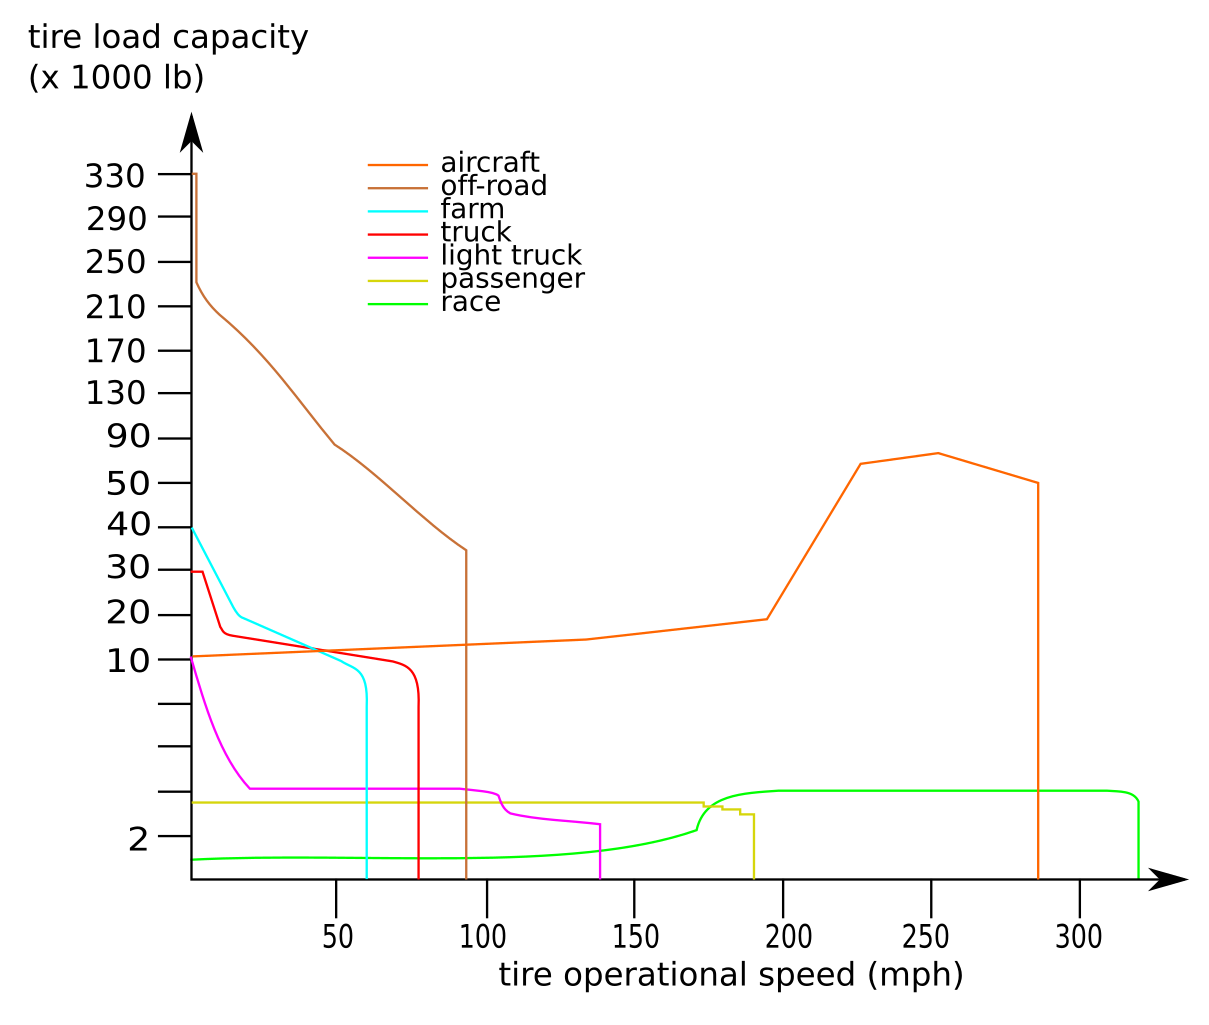
tire performance envelope comparison graphic |
|---|---|
| Source |
based on published image from Goodyear |
| Date |
2013-02-01 |
| Author | |
| Permission (Reusing this file) |
See below.
|
- Other information
Vectorized and unified graph based on published image from Goodyear found at http://www.goodyearaviation.com/resources/pdf/db_airdatabook.pdf
Licensing
File history
Click on a date/time to view the file as it appeared at that time.
| Date/Time | Thumbnail | Dimensions | User | Comment | |
|---|---|---|---|---|---|
| current | 20:35, 24 February 2013 | | 522 × 442 (44 KB) | DePiep (talk | contribs) | rm 2nd scale, set orange line (aircraft tyres) to same, lefthand scale. As per GL/I request. |
| 14:03, 1 February 2013 |  | 521 × 405 (35 KB) | Mightyname (talk | contribs) | Uploading a self-made file using File Upload Wizard |
You cannot overwrite this file.
File usage
The following pages on the English Wikipedia use this file (pages on other projects are not listed):