Size of this preview: 800 × 428 pixels. Other resolutions: 320 × 171 pixels | 640 × 342 pixels | 1,024 × 548 pixels | 1,440 × 770 pixels.
Original file (1,440 × 770 pixels, file size: 502 KB, MIME type: image/jpeg)
Summary
| Description |
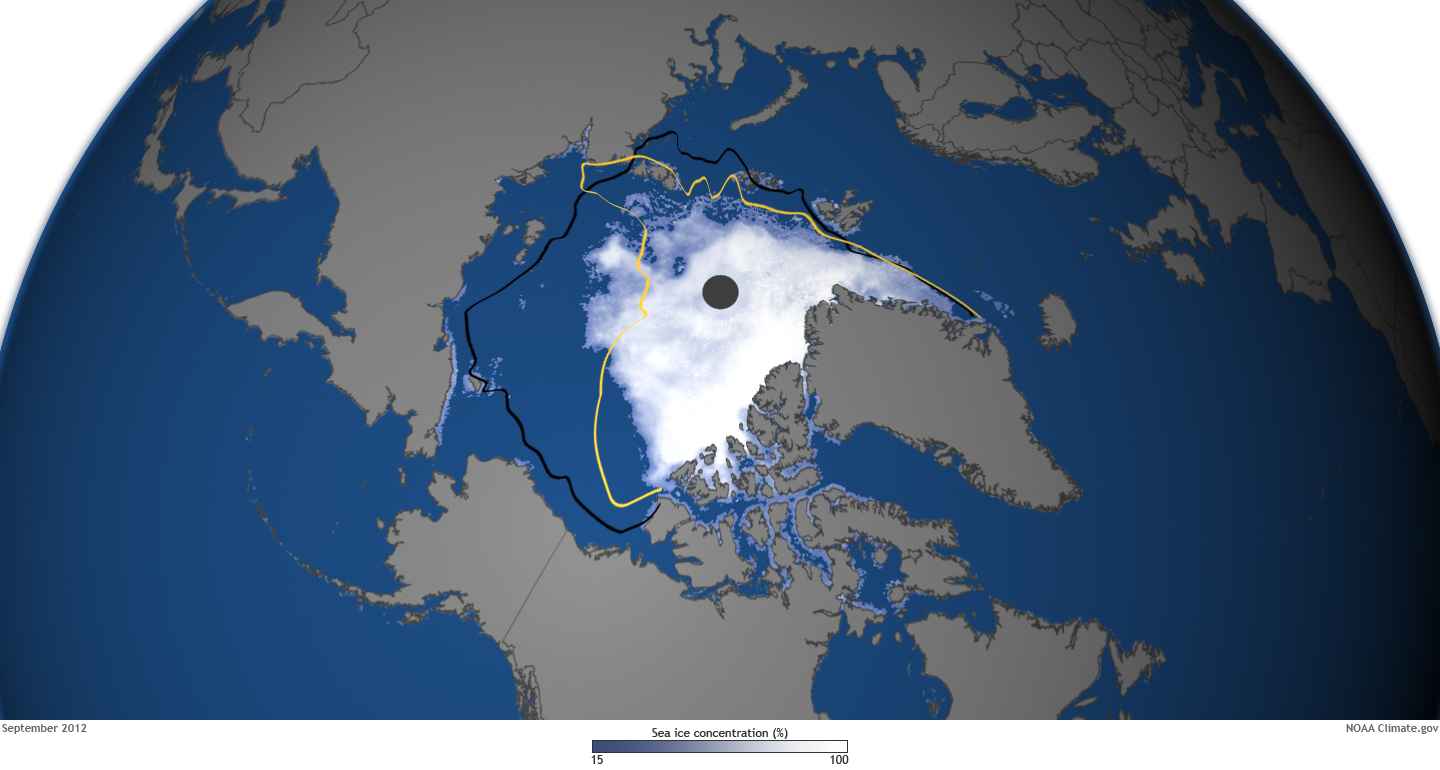
This map shows ice concentration on September 16, along with the extent of the previous record low (yellow line) and the mid-September median extent (black line). in mid-September, the ice extent had shrunk down to just 1.3 million square miles (3.41 square kilometers), setting a new record low that was 18 percent smaller than the previous record and nearly 50 percent smaller than the long-term (1979-2000) average. |
|---|---|
| Source |
http://www.climatewatch.noaa.gov/wp-content/uploads/2012/12/SeaIce-Sept162012_HR.jpg |
| Date |
2012 |
| Author |
Dan Pisut |
| Permission (Reusing this file) |
See below.
|
Licensing
File history
Click on a date/time to view the file as it appeared at that time.
| Date/Time | Thumbnail | Dimensions | User | Comment | |
|---|---|---|---|---|---|
| current | 02:21, 1 May 2013 | | 1,440 × 770 (502 KB) | David.moreno72 (talk | contribs) | Uploading a public-domain item using File Upload Wizard |
You cannot overwrite this file.
File usage
No pages on the English Wikipedia use this file (pages on other projects are not listed).