Original file (875 × 1,143 pixels, file size: 239 KB, MIME type: image/jpeg)
Summary
| Description |
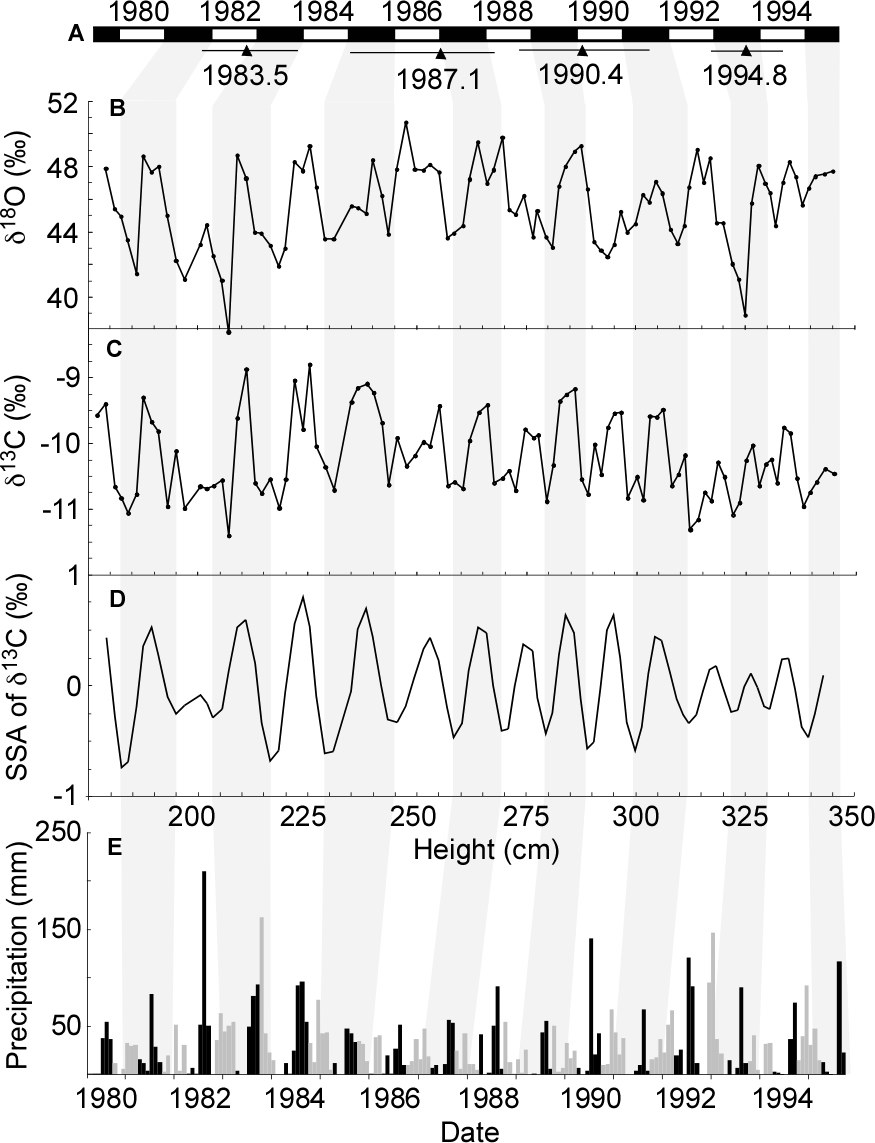
A record of isotopic variation in spine tips spanning 1.77 m of a saguaro cactus in Tucson, Arizona. Bars at top (A) are interpolated years based on measured heights in 1970 and 1993 (Pierson and Turner[1]) and filled triangles with lines are corrected F14C ages with 2σ age ranges (i.e. F14C age minus 1.9 years). Spine tip δ18O values (B) and δ13C values (C) plotted by height from the base of the plant are shown with a singular spectrum analysis (SSA) of δ13C for comparison (D). Monthly precipitation values at Tumamoc Hill (E) are shown for October through March (grey bars) and April through September (black bars). The year 1993 of the timescale at the top (A) and on the bottom axis (E) of this figure are anchored to (i.e in line with) a height of 320 cm. Increased precipitation in the spring of 1983 and winter of 1992–93 coincided with El Niño in those years. Shaded bars from top to bottom denote correlated years. |
|---|---|
| Source |
English et al. 2007 Past climate changes and ecophysiological responses recorded in the isotope ratios of saguaro cactus spines. Oecologia 154:247–258. DOI 10.1007/s00442-007-0832-x |
| Date |
2007 |
| Author |
N.B. English |
| Permission (Reusing this file) |
Springer License#2413941503019
|
Licensing
References
- ^ Pierson and Turner: An 85-year study of Saguaro(Carnegiea gigantea) demography. Ecology 79:2676–2693
<reference/>
File history
Click on a date/time to view the file as it appeared at that time.
| Date/Time | Thumbnail | Dimensions | User | Comment | |
|---|---|---|---|---|---|
| current | 01:57, 22 April 2010 | | 875 × 1,143 (239 KB) | Nenglish (talk | contribs) | {{Information |Description = A record of isotopic variation in spine tips spanning 1.77 m of a saguaro cactus in Tucson, AZ. Bars at top (A) are interpolated years based on measured heights in 1970 and 1993 (Pierson and Turner 1998) and filled triangl |
You cannot overwrite this file.