Removing “historical” from “map projections”. Corrected descriptions. Removed material that was confusing or that adds little. |
No edit summary |
||
| Line 1: | Line 1: | ||
{{About|maps of the Earth}} |
{{About|maps of the Earth}} |
||
{{refimprove|date=May 2013}} |
{{refimprove|date=May 2013}} |
||
[[ |
[[File:World Map 1689.JPG|thumb|249px|An historical map of the world by [[Gerard van Schagen]], 1689]] |
||
| ⚫ | [[File:Winkel triple projection SW.jpg|right|249px|thumb|A world map exemplifying the use of the [[Winkel tripel projection]] and the [[Mollweide projection]], it is considered to be a low-error map projection<ref>''[http://www.physics.drexel.edu/~goldberg/projections/goldberg_gott.pdf Large-Scale Distortions in Map Projections]'', 2007, David M. Goldberg & [[J. Richard Gott]] III, 2007, V42 N4.</ref> adopted by the [[National Geographic Society]] for reference maps.]] |
||
[[File:World Map 1689.JPG|thumb|300px|An historical map of the world by [[Gerard van Schagen]], 1689]] |
|||
A '''world map''' is a [[map]] of most or all of the surface of the [[Earth]]. World maps form a distinctive category of maps due to the problem of [[Map projection|projection]]. Maps by necessity distort the presentation of the earth's surface. These distortions reach extremes in a world map. The many ways of projecting the earth reflect diverse technical and æsthetic goals for world maps.<ref name="ACA1988"> |
A '''world map''' is a [[map]] of most or all of the surface of the [[Earth]]. World maps form a distinctive category of maps due to the problem of [[Map projection|projection]]. Maps by necessity distort the presentation of the earth's surface. These distortions reach extremes in a world map. The many ways of projecting the earth reflect diverse technical and æsthetic goals for world maps.<ref name="ACA1988"> |
||
{{cite book |
{{cite book |
||
| Line 18: | Line 18: | ||
==Map projections== |
==Map projections== |
||
| ⚫ | [[File:Winkel triple projection SW.jpg|right| |
||
{{Main|Map projection|List of map projections}} |
{{Main|Map projection|List of map projections}} |
||
| Line 25: | Line 24: | ||
<gallery widths="175px"> |
<gallery widths="175px"> |
||
Image:World Map flat Mercator.png | [[Mercator projection]] |
Image:World Map flat Mercator.png | [[Mercator projection]] |
||
File:Mollweide projection SW.jpg | [[Mollweide projection]] |
|||
Image:Cahill Butterfly Map.jpg | [[B. J. S. Cahill Butterfly Map, 1909, from 1919 pamphlet]] |
Image:Cahill Butterfly Map.jpg | [[B. J. S. Cahill Butterfly Map, 1909, from 1919 pamphlet]] |
||
<!-- Deleted image removed: Image:Waterman_Butterfly_Map_1996.jpg | [[Waterman butterfly projection|Waterman Butterfly Map, 1996]] --> |
<!-- Deleted image removed: Image:Waterman_Butterfly_Map_1996.jpg | [[Waterman butterfly projection|Waterman Butterfly Map, 1996]] --> |
||
| Line 31: | Line 29: | ||
File:Azimuthal equidistant projection SW.jpg|[[Geographical pole|Polar]] azimuthal equidistant projection |
File:Azimuthal equidistant projection SW.jpg|[[Geographical pole|Polar]] azimuthal equidistant projection |
||
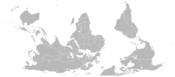
Image:Blank-map-world-south-up.png|A [[reversed map|south-up map]] |
Image:Blank-map-world-south-up.png|A [[reversed map|south-up map]] |
||
| ⚫ | |||
</gallery> |
</gallery> |
||
| Line 41: | Line 40: | ||
Image:Elevation.jpg | [[Elevation]] map |
Image:Elevation.jpg | [[Elevation]] map |
||
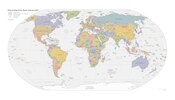
Image:CIA WorldFactBook-Political world.pdf| A simple political map of the world as of 2011 |
Image:CIA WorldFactBook-Political world.pdf| A simple political map of the world as of 2011 |
||
| ⚫ | |||
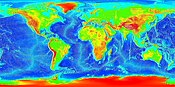
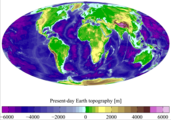
Image:AYool topography 15min.png | Present day [[Earth]] [[terrain|altimetry]] and [[bathymetry]] ([[Mollweide projection]]) |
Image:AYool topography 15min.png | Present day [[Earth]] [[terrain|altimetry]] and [[bathymetry]] ([[Mollweide projection]]) |
||
Image:World map.png | [[Topographical]] map of the world |
Image:World map.png | [[Topographical]] map of the world |
||
File:World map by skin color for modern populations.jpg| Map representing the effects of human displacement trends in the last centuries. |
|||
File:CO2 responsibility 1950-2000.svg | map of anthropogenic CO<sub>2</sub> emission by country |
File:CO2 responsibility 1950-2000.svg | map of anthropogenic CO<sub>2</sub> emission by country |
||
File:UN Human Development Report 2008.svg | UN Human Development Index by country as of 2008 |
File:UN Human Development Report 2008.svg | UN Human Development Index by country as of 2008 |
||
| Line 61: | Line 60: | ||
File:Claes Janszoon Visscher - Nova Totius Terrarum Orbis Geographica Ac Hydrographica Tabula Autore'.jpg | 1652 world map by Visscher |
File:Claes Janszoon Visscher - Nova Totius Terrarum Orbis Geographica Ac Hydrographica Tabula Autore'.jpg | 1652 world map by Visscher |
||
File:Radkarte MKL1888.png|Ideal reconstruction of medieval world maps (from ''Meyers Konversationslexikon'', 1895) (Asia shown on the right) |
File:Radkarte MKL1888.png|Ideal reconstruction of medieval world maps (from ''Meyers Konversationslexikon'', 1895) (Asia shown on the right) |
||
File:Anaximander world map-it.svg|Hypothetical reconstruction of the world map of |
File:Anaximander world map-it.svg|Hypothetical reconstruction of the world map of |
||
Image:OrteliusWorldMap1570.jpg|An historical map of the world by [[Abraham Ortelius|Ortelius]], 1570 |
|||
[[Anaximander]] (610–546 BC) |
|||
</gallery> |
</gallery> |
||
</center> |
</center> |
||
Revision as of 00:29, 27 September 2013


A world map is a map of most or all of the surface of the Earth. World maps form a distinctive category of maps due to the problem of projection. Maps by necessity distort the presentation of the earth's surface. These distortions reach extremes in a world map. The many ways of projecting the earth reflect diverse technical and æsthetic goals for world maps.[2]
World maps are also distinct for the global knowledge required to construct them. A meaningful map of the world could not be constructed before the European Renaissance because less than half of the earth's coastlines, let alone its interior regions, were known to any culture. New knowledge of the earth's surface has been accumulating ever since and continues to this day.
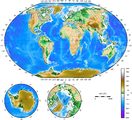
Maps of the world generally focus either on political features or on physical features. Political maps emphasize territorial boundaries and human settlement. Physical maps show geographic features such as mountains, soil type or land use. Geological maps show not only the surface, but characteristics of the underlying rock, fault lines, and subsurface structures. Choropleth maps use color hue and intensity to contrast differences between regions, such as demographic or economic statistics.
Map projections
A map is made using a map projection, which is any method of representing a globe on a plane. All projections distort distances and directions, and each projection distributes those distortions differently. Perhaps the most well known projection is the Mercator Projection, originally designed as a nautical chart.
-

-

-
Dymaxion projection
-
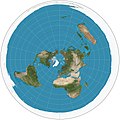 Polar azimuthal equidistant projection
 -
-


Thematic maps
A thematic map shows geographic information about one or a few focused subjects. These maps "can portray physical, social, political, cultural, economic, sociological, agricultural, or any other aspects of a city, state, region, nation, or continent".[3]
-
 Clickable world map (with climate classification)
 -
 Elevation map
 -
 A simple political map of the world as of 2011
 -
-
 Topographical map of the world
 -
Map representing the effects of human displacement trends in the last centuries.Map representing the effects of human displacement trends in the last centuries.
-
 map of anthropogenic CO2 emission by country
 -
 UN Human Development Index by country as of 2008
 -
 World map showing life expectancy
 -
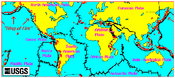 Volcano map
 -
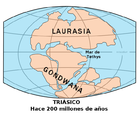 world map showing the continents as of 200 million years ago (Triassic period)


Historical maps
Early world maps cover depictions of the world from the Iron Age to the Age of Discovery and the emergence of modern geography during the early modern period. Old maps provide much information about what was known in times past, as well as the philosophy and cultural basis of the map, which were often much different from modern cartography. Maps are one means by which scientists distribute their ideas and pass them on to future generations.[4]
-
 World map according to Posidonius (150–130 BC), drawn in 1628.
 -
 Tabula Rogeriana world map by Muhammad al-Idrisi in 1154. Note that north is to the bottom
 -
 1652 world map by Visscher
 -
 Ideal reconstruction of medieval world maps (from Meyers Konversationslexikon, 1895) (Asia shown on the right)
 -
 Hypothetical reconstruction of the world map of
 -
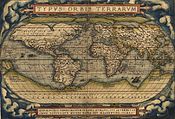 An historical map of the world by Ortelius, 1570


See also
References
- ^ Large-Scale Distortions in Map Projections, 2007, David M. Goldberg & J. Richard Gott III, 2007, V42 N4.
- ^ American Cartographic Association's Committee on Map Projections (1988). Choosing a World Map. Falls Church: American Congress on Surveying and Mapping. pp. 1–2.
- ^ Thematic Maps Map Collection & Cartographic Information Services Unit. University Library, University of Washington. Accessed 27 Dec 2009.
- ^ http://academic.emporia.edu/aberjame/map/h_map/h_map.htm
Further reading
- Edson, Evelyn (2011). The World Map, 1300–1492: The Persistence of Tradition and Transformation. JHU Press. ISBN 1421404303
- Harvey, P. D. A. (2006). The Hereford world map: medieval world maps and their context. British Library. ISBN 0712347607