BitterGiant (talk | contribs) No edit summary |
David Biddulph (talk | contribs) →Political control: unterminated table |
||
| Line 136: | Line 136: | ||
| style="text-align: center; | - |
| style="text-align: center; | - |
||
|- |
|- |
||
} |
|} |
||
==Council elections== |
==Council elections== |
||
Revision as of 19:47, 20 August 2018

Richmond upon Thames London Borough Council elections are held every four years for all 54 councillor seats in the 18 wards that make up the Borough Council.[1] By-elections are held in individual wards when vacancies arise outside the four-year cycle.
Political control
Since 1964 political control of the council has been held by the following parties:[2]
| Election | Overall Control | Conservative | Lib Dem | Labour | Green | Ind. |
|---|---|---|---|---|---|---|
| 1964 | style="background:Template:Conservative Party (UK)/meta/color; color:white" | Conservative | 41 | - | 12 | - | 1 |
| 1968 | style="background:Template:Conservative Party (UK)/meta/color; color:white" | Conservative | 54 | - | - | - | - |
| 1971 | style="background:Template:Conservative Party (UK)/meta/color; color:white" | Conservative | 36 | 3 | 15 | - | - |
| 1974 | style="background:Template:Conservative Party (UK)/meta/color; color:white" | Conservative | 36 | 10 | 8 | - | - |
| 1978 | style="background:Template:Conservative Party (UK)/meta/color; color:white" | Conservative | 34 | 18 | - | - | - |
| 1982 | style="background:Template:No overall control/meta/color; color:white" | No overall control | 26 | 26 | - | - | - |
| 1986 | style="background:Template:SDP–Liberal Alliance/meta/color; color:black" | SDP–Liberal Alliance | 3 | 49 | - | - | - |
| 1990 | style="background:Template:Liberal Democrats (UK)/meta/color; color:black" | Liberal Democrats | 4 | 48 | - | - | - |
| 1994 | style="background:Template:Liberal Democrats (UK)/meta/color; color:black" | Liberal Democrats | 7 | 43 | 2 | - | - |
| 1998 | style="background:Template:Liberal Democrats (UK)/meta/color; color:black" | Liberal Democrats | 14 | 34 | 4 | - | - |
| 2002 | style="background:Template:Conservative Party (UK)/meta/color; color:white" | Conservative | 39 | 15 | - | - | - |
| 2006 | style="background:Template:Liberal Democrats (UK)/meta/color; color:black" | Liberal Democrats | 18 | 35 | - | - | 1 |
| 2010 | style="background:Template:Conservative Party (UK)/meta/color; color:white" | Conservative | 30 | 24 | - | - | - |
| 2014 | style="background:Template:Conservative Party (UK)/meta/color; color:white" | Conservative | 39 | 15 | - | - | - |
| 2018 | style="background:Template:Liberal Democrats (UK)/meta/color; color:black" | Liberal Democrats | 11 | 39 | - | 4 | - |
Council elections
- Richmond upon Thames London Borough Council election, 1964
- Richmond upon Thames London Borough Council election, 1968 (boundary changes took place but the number of seats remained the same)[3]
- Richmond upon Thames London Borough Council election, 1971 (boundary changes took place but the number of seats remained the same)[n 1]
- Richmond upon Thames London Borough Council election, 1974
- Richmond upon Thames London Borough Council election, 1978 (boundary changes reduced the number of seats by two)[4]
- Richmond upon Thames London Borough Council election, 1982
- Richmond upon Thames London Borough Council election, 1986
- Richmond upon Thames London Borough Council election, 1990
- Richmond upon Thames London Borough Council election, 1994 (boundary changes took place but the number of seats remained the same)[n 2][n 3]
- Richmond upon Thames London Borough Council election, 1998 (boundary changes took place but the number of seats remained the same)[n 4]
- Richmond upon Thames London Borough Council election, 2002 (boundary changes increased the number of seats by two)[5][6]
- Richmond upon Thames London Borough Council election, 2006
- Richmond upon Thames London Borough Council election, 2010
- Richmond upon Thames London Borough Council election, 2014
- Richmond upon Thames London Borough Council election, 2018
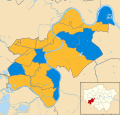
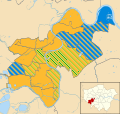
Borough result maps
-
 2002 results map
 -
 2006 results map
 -
 2010 results map
 -
 2014 results map
 -
 2018 results map


By-election results
1964–1968
There were no by-elections.[3]
1968–1971
| Party | Candidate | Votes | % | ±% | |
|---|---|---|---|---|---|
| Conservative | P. J. Maitland | 1199 | |||
| Independent | M. V. Smith | 618 | |||
| Labour | A. G. H. Lawrance | 151 | |||
| Turnout | 31.7% | ||||
| Party | Candidate | Votes | % | ±% | |
|---|---|---|---|---|---|
| Conservative | J. K. Baker | 1160 | |||
| Liberal | A. D. Reddrop | 615 | |||
| Labour | Mrs J. M. Hyam | 262 | |||
| Turnout | 24.2% | ||||
| Party | Candidate | Votes | % | ±% | |
|---|---|---|---|---|---|
| Conservative | Mrs H. M. Abell | 603 | |||
| Liberal | Dr S. Rundle | 569 | |||
| Independent | A. P. Warren | 248 | |||
| Labour | A. B. Hart | 207 | |||
| Turnout | 26.7% | ||||
| Party | Candidate | Votes | % | ±% | |
|---|---|---|---|---|---|
| Liberal | Dr S. Rundle | 1676 | |||
| Conservative | Miss J. M. Hooper | 1079 | |||
| Labour | Miss D. J. Kidger | 323 | |||
| Turnout | 35.7% | ||||
| Party | Candidate | Votes | % | ±% | |
|---|---|---|---|---|---|
| Conservative | G. M. Cooper | 1766 | |||
| Liberal | R. D. McArthur | 605 | |||
| Labour | Miss J. R. F. Brown | 405 | |||
| Turnout | 37.4% | ||||
| Party | Candidate | Votes | % | ±% | |
|---|---|---|---|---|---|
| Conservative | T. A. Bligh | 1266 | |||
| Labour | P. T. Z. Goldring | 391 | |||
| Liberal | Mrs D. O. Collins | 374 | |||
| Turnout | 28.6% | ||||
| Party | Candidate | Votes | % | ±% | |
|---|---|---|---|---|---|
| Conservative | P. G. Lockyer | 1065 | |||
| Labour | K. L. Elmes | 502 | |||
| Liberal | J. E. Twaits | 361 | |||
| Turnout | 25.3% | ||||
| Party | Candidate | Votes | % | ±% | |
|---|---|---|---|---|---|
| Conservative | J. M. Russell | 1190 | |||
| Liberal | R. W. Marlow | 435 | |||
| Labour | E. C. Eldridge | 424 | |||
| Turnout | 28.9% | ||||
| Party | Candidate | Votes | % | ±% | |
|---|---|---|---|---|---|
| Conservative | T. J. Attwood | 1081 | |||
| Labour | K. L. Elmes | 525 | |||
| Liberal | J. E. Twaits | 377 | |||
| Turnout | 24.5% | ||||
1971–1974
| Party | Candidate | Votes | % | ±% | |
|---|---|---|---|---|---|
| Labour | G. E. F. Samuels | 1,530 | |||
| Conservative | P. G. Lockyer | 1,196 | |||
| Liberal | J. E. Twaits | 160 | |||
| Turnout | 35.5% | ||||
| Party | Candidate | Votes | % | ±% | |
|---|---|---|---|---|---|
| Labour | M. J. Powell | 1,232 | |||
| Conservative | R. K. Morland | 1,087 | |||
| Liberal | R. W. Marlow | 390 | |||
| Turnout | 41.6% | ||||
| Party | Candidate | Votes | % | ±% | |
|---|---|---|---|---|---|
| Labour | Mrs J. M. Pardington | 1,109 | |||
| Conservative | Miss M. C. Gregory | 1,012 | |||
| Liberal | S. J. Nunn | 244 | |||
| Ind. Conservative | Mrs A. Woodward | 185 | |||
| Turnout | 37.3% | ||||
| Party | Candidate | Votes | % | ±% | |
|---|---|---|---|---|---|
| Liberal | J. Waller | 1,301 | |||
| Conservative | J. L. Saunders | 937 | |||
| Labour | R. G. Marshall-Andrews | 928 | |||
| Turnout | 48.1 % | ||||
1974–1978
| Party | Candidate | Votes | % | ±% | |
|---|---|---|---|---|---|
| Liberal | Anthony L. Manners | 1,769 | |||
| Conservative | Margery Segar | 1,253 | |||
| Labour | John P. Sheppard | 519 | |||
| Turnout | 51.5 | ||||
| Party | Candidate | Votes | % | ±% | |
|---|---|---|---|---|---|
| Liberal | Bryan T. B. Lewis | 1,651 | |||
| Conservative | John L. Saunders | 1,100 | |||
| Labour | Roy F. Piper | 421 | |||
| Ratepayers | Joshua P. Kielty | 253 | |||
| Turnout | 54.4 | ||||
| Party | Candidate | Votes | % | ±% | |
|---|---|---|---|---|---|
| Liberal | David C. Cornwell | 1,722 | |||
| Conservative | Patrick V. Marshall | 1,718 | |||
| Labour | Joy P. Mostyn | 577 | |||
| Turnout | 56.3 | ||||
Following the discovery of a series of voting errors, the High Court on 5 August 1976, declared the Liberal candidate in place of the Conservative. The revised votes are recorded here.
| Party | Candidate | Votes | % | ±% | |
|---|---|---|---|---|---|
| Liberal | Marie C. Biddulph | 1,716 | |||
| Labour | Roger D. Smith | 1,182 | |||
| Conservative | Vera Goodman | 810 | |||
| Turnout | 57.3 | ||||
| Party | Candidate | Votes | % | ±% | |
|---|---|---|---|---|---|
| Conservative | Peter J. Temlett | 1,637 | |||
| Liberal | Sidney J. Marshall | 1,229 | |||
| Labour | John W. Shelton | 558 | |||
| National Front | Terence Denville-Faulkner | 57 | |||
| Turnout | 50.8 | ||||
| Party | Candidate | Votes | % | ±% | |
|---|---|---|---|---|---|
| Liberal | Deirdre B. Martineau | 1,668 | |||
| Conservative | Christopher Sandy | 826 | |||
| Labour | Joy P. Mostyn | 734 | |||
| Turnout | 57.6 | ||||
1978–1982
1982–1986
1986–1990
1990–1994
| Party | Candidate | Votes | % | ±% | |
|---|---|---|---|---|---|
| Liberal Democrats | John W. G. Coombs | 896 | 40.1 | ||
| Conservative | Jennie E. Edwards | 786 | 35.2 | ||
| Labour | Michael D. Gold | 457 | 20.5 | ||
| Green | Rowland R. Morgan | 54 | 2.4 | ||
| National Front | Jeremy Bedford-Turner | 40 | 1.8 | ||
| Turnout | 43.1 | ||||
| Liberal Democrats gain from Conservative | Swing | ||||
The by-election was called following the resignation of Cllr. Anthony T. Johnson.
| Party | Candidate | Votes | % | ±% | |
|---|---|---|---|---|---|
| Liberal Democrats | Robert D. Parslow | 1,430 | 46.4 | ||
| Conservative | Anne Woodward | 1,236 | 40.1 | ||
| Labour | Martin P. Cross | 413 | 13.4 | ||
| Turnout | 48.2 | ||||
| Liberal Democrats hold | Swing | ||||
The by-election was called following the death of Cllr. Gavin Alexander.
1994–1998
| Party | Candidate | Votes | % | ±% | |
|---|---|---|---|---|---|
| Liberal Democrats | Joanna Frith | 1,377 | |||
| Conservative | Peter J. Temlett | 990 | |||
| Labour | Christopher J. Boaler | 686 | |||
| Turnout | |||||
| Liberal Democrats hold | Swing | ||||
The by-election was called following the resignation of Cllr. Elaine I. Pippard.
| Party | Candidate | Votes | % | ±% | |
|---|---|---|---|---|---|
| Liberal Democrats | John W. Coombs | 972 | 36.0 | ||
| Conservative | Mary A. Rae | 908 | 33.7 | ||
| Labour | Graham R. Nixon | 818 | 30.3 | ||
| Majority | 64 | 2.3 | |||
| Turnout | 2,698 | 49.5 | |||
| Liberal Democrats gain from Conservative | Swing | ||||
The by-election was called following the resignation of Cllr. Philip A. Northey.
| Party | Candidate | Votes | % | ±% | |
|---|---|---|---|---|---|
| Liberal Democrats | Eleanor M. Stanier | 908 | 42.9 | ||
| Conservative | Malcolm K. McAlister | 615 | 29.0 | ||
| Labour | Michelle Thew | 594 | 28.1 | ||
| Majority | 293 | 13.9 | |||
| Turnout | 2,120 | 35.2 | |||
| Liberal Democrats hold | Swing | ||||
The by-election was called following the resignation of Cllr. Susan E. Fenwick.
| Party | Candidate | Votes | % | ±% | |
|---|---|---|---|---|---|
| Conservative | Geoffrey J. Samuel | 1,138 | 40.3 | -0.1 | |
| Liberal Democrats | John R. Gossage | 1,096 | 38.8 | -3.0 | |
| Labour | Stephen J. Cox | 591 | 20.9 | +3.1 | |
| Majority | 42 | 1.5 | |||
| Turnout | 2,825 | 42.1 | |||
| Conservative gain from Liberal Democrats | Swing | ||||
The by-election was called following the resignation of Cllr. David A. R. Martin.
1998–2002
| Party | Candidate | Votes | % | ±% | |
|---|---|---|---|---|---|
| Conservative | Nicola Urquhart | 1,496 | 49.1 | +7.5 | |
| Liberal Democrats | Julian D. Rudd | 1,215 | 39.9 | -6.3 | |
| Labour | Maureen H. Metzger | 333 | 10.9 | -1.3 | |
| Majority | 281 | 9.2 | |||
| Turnout | 3,044 | 48.3 | |||
| Conservative hold | Swing | ||||
The by-election was called following the resignation of Cllr. Helen Blake.
2002–2006
| Party | Candidate | Votes | % | ±% | |
|---|---|---|---|---|---|
| Liberal Democrats | Eleanor M. Stanier | 936 | 44.5 | +14.0 | |
| Conservative | Jane M. West | 927 | 44.1 | +4.2 | |
| Labour | Benjamin R. Stanier | 132 | 6.3 | -23.3 | |
| Green | James R. Page | 109 | 5.2 | +5.2 | |
| Majority | 9 | 0.4 | |||
| Turnout | 2,104 | 30.3 | |||
| Liberal Democrats gain from Conservative | Swing | ||||
The by-election was called following the death of Cllr. John L. Saunders.
| Party | Candidate | Votes | % | ±% | |
|---|---|---|---|---|---|
| Liberal Democrats | Jane A. Arneil | 1,722 | 54.7 | +11.3 | |
| Conservative | Ewan G. Wallace | 1,235 | 39.3 | -5.8 | |
| Green | Sylvia R. Levi | 104 | 3.3 | +3.3 | |
| Labour | John Simon Fowler | 85 | 2.7 | -8.9 | |
| Majority | 487 | 15.4 | |||
| Turnout | 3,146 | 46.6 | |||
| Liberal Democrats hold | Swing | ||||
The by-election was called following the death of Cllr. Anthony J. Barnett.
| Party | Candidate | Votes | % | ±% | |
|---|---|---|---|---|---|
| Liberal Democrats | Suzette B. Nicholson | 1,669 | 57.9 | +18.3 | |
| Conservative | Stuart N. Leamy | 1,111 | 38.6 | -10.4 | |
| Labour | Kanbar Hosseinbor | 101 | 3.5 | -8.0 | |
| Majority | 558 | 19.3 | |||
| Turnout | 2,881 | 42.0 | |||
| Liberal Democrats gain from Conservative | Swing | ||||
The by-election was called following the death of Cllr. Jean M. Matthews.
| Party | Candidate | Votes | % | ±% | |
|---|---|---|---|---|---|
| Liberal Democrats | Celia J. Hodges | 1,384 | 51.9 | +14.9 | |
| Conservative | Paul Hodgins | 1,043 | 39.1 | -4.7 | |
| Labour | Barnaby J. L. Marder | 129 | 4.8 | -5.6 | |
| Green | Sylvia Wills | 110 | 4.1 | +4.1 | |
| Majority | 341 | 12.8 | |||
| Turnout | 2,666 | 39.6 | |||
| Liberal Democrats gain from Conservative | Swing | ||||
The by-election was called following the resignation of Cllr. Marc L. Cranfield-Adams.
| Party | Candidate | Votes | % | ±% | |
|---|---|---|---|---|---|
| Liberal Democrats | David S. F. Trigg | 2,111 | 45.8 | +5.3 | |
| Conservative | Nicholas J. F. Lait | 1,513 | 32.8 | -9.4 | |
| Labour | John Grant | 548 | 11.9 | -5.4 | |
| Green | Henry B. L. Gower | 435 | 9.4 | +9.4 | |
| Majority | 598 | 13.0 | |||
| Turnout | 4,607 | ||||
| Liberal Democrats gain from Conservative | Swing | ||||
The by-election was called following the death of Cllr. Derek Beattie.
2006–2010
| Party | Candidate | Votes | % | ±% | |
|---|---|---|---|---|---|
| Conservative | Rita G. S. Palmer | 1,643 | 56.2 | +3.8 | |
| Liberal Democrats | Barbara Westmorland | 1,103 | 37.7 | -5.8 | |
| Labour | Ann F. Neimer | 91 | 3.1 | -1.0 | |
| Green | James R. Page | 87 | 3.0 | +3.0 | |
| Majority | 540 | 18.5 | |||
| Turnout | 2,924 | 41.2 | |||
| Conservative hold | Swing | ||||
The by-election was called following the resignation of Cllr. Benedict A. Stanberry.
2010–2014
| Party | Candidate | Votes | % | ±% | |
|---|---|---|---|---|---|
| Conservative | Stephen Speak | 1733 | |||
| Liberal Democrats | Ms. Jane Dodds | 1587 | |||
| Labour | Brian Caton | 364 | |||
| Green | James R. Page | 206 | |||
| Independent | Marc L. Cranfield-Adams | 123 | |||
| Turnout | 52.4% | ||||
| Conservative hold | Swing | ||||
The by-election was called following the resignation of Cllr. Richard J. Montague.
2014–2018
| Party | Candidate | Votes | % | ±% | |
|---|---|---|---|---|---|
| Liberal Democrats | Geraldine Locke | 1,189 | 43.0 | +25.0 | |
| Conservative | Jon Hollis | 1,081 | 39.1 | -10.6 | |
| Green | Anthony Breslin | 237 | 8.6 | -9.9 | |
| Labour | Paul Tanto | 185 | 6.7 | -7.2 | |
| UKIP | Sam Naz | 69 | 2.5 | N/A | |
| Independent | Michael John Lloyd | 7 | 0.3 | N/A | |
| Majority | 108 | 3.9 | |||
| Turnout | 2,769 | 34.89 | |||
| Liberal Democrats gain from Conservative | Swing | ||||
The by-election was called following the resignation of Councillor Tania Mathias, of the Conservative Party, following her election as the Member of Parliament for Twickenham.
References
- ^ The Greater London and Surrey Order, 1970
- ^ The Greater London and Surrey (County and London Borough Boundaries) (No. 2) Order 1993
- ^ The Greater London and Surrey (County and London Borough Boundaries) (No. 4) Order 1993
- ^ The Greater London and Surrey (County and London Borough Boundaries) Order 1994
- ^ "Councillors". London Borough of Richmond upon Thames. Retrieved 14 March 2010.
- ^ "Election 2010 – Richmond-Upon-Thames". BBC News. 19 April 2009. Retrieved 2 March 2015.
- ^ a b "London Borough Council Elections 9 May 1968" (PDF). London Datastore. Greater London Council. Retrieved 24 February 2015.
- ^ a b c d e f g "London Borough Council Elections 4 May 1978" (PDF). London Datastore. Greater London Council. Retrieved 25 February 2015.
- ^ "Local elections 2002: Council – Richmond-upon-Thames". BBC News. Retrieved 2 March 2015.
- ^ a b "London Borough Council Elections 2 May 2002" (PDF). London Datastore. Greater London Authority. Retrieved 25 February 2015.
- ^ a b c d e f g h i "London Borough Council Elections 13 May 1971" (PDF). London Datastore. Greater London Council. Retrieved 3 March 2015.
- ^ a b c d "London Borough Council Elections 2 May 1974" (PDF). London Datastore. Greater London Council. Retrieved 25 February 2015.
- ^ a b "London Borough Council By-elections May 1990 to May 1994" (PDF). London Datastore. London Research Centre. Retrieved 8 March 2015.
- ^ a b c d "London Borough Council Elections 7 May 1998 including the Greater London Authority Referendum results" (PDF). London Datastore. London Research Centre. Retrieved 8 March 2015.
- ^ "Results of the Mortlake and Barnes Common Ward By Election, 7 August 2003". London Borough of Richmond upon Thames. Retrieved 14 March 2010.
- ^ "Results of the Kew Ward By-Election, 18 December 2003". London Borough of Richmond upon Thames. Retrieved 14 March 2010.
- ^ "Results of the Hampton By-election, 7th October 2004". London Borough of Richmond upon Thames. Retrieved 14 March 2010.
- ^ "Results of the North Richmond Ward by-election, 27th January 2005". London Borough of Richmond upon Thames. Retrieved 14 March 2010.
- ^ "Results of by-election for Twickenham Riverside Ward, 5th May 2005". London Borough of Richmond upon Thames. Retrieved 14 March 2010.
- ^ "Results of the Barnes Ward By-Election, 6th December 2007". London Borough of Richmond upon Thames. Retrieved 14 March 2010.
- ^ "London Borough Council Elections 22 May 2014" (PDF). London Datastore. Greater London Authority. Retrieved 26 February 2015.
- ^ http://cabnet.richmond.gov.uk/mgElectionAreaResults.aspx?ID=79&RPID=18696566