
Size of this preview: 637 × 599 pixels. Other resolutions: 255 × 240 pixels | 510 × 480 pixels | 894 × 841 pixels.
Original file (894 × 841 pixels, file size: 14 KB, MIME type: image/png)
Summary
| Description |
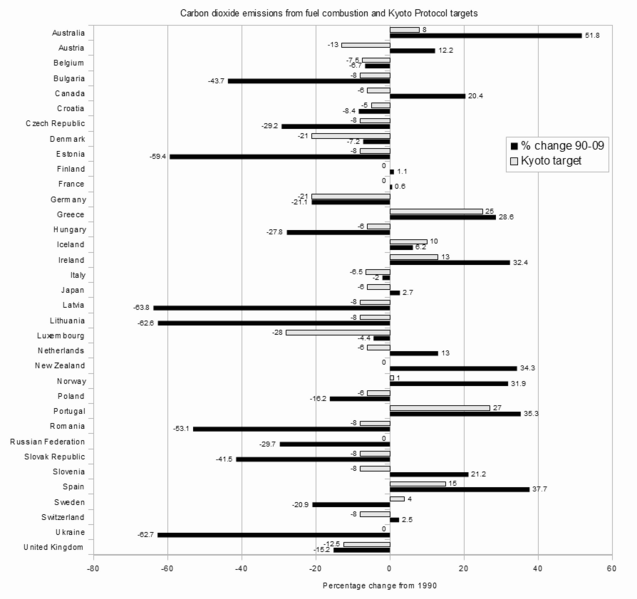
English: This bar graph shows Kyoto Parties with first period (2008-2012) greenhouse gas emissions limitations targets and the percentage change in their carbon dioxide emissions from fuel combustion between 1990 and 2009. The Kyoto targets apply to a “basket” of six greenhouse gases and allow sinks (i.e., activities that remove carbon from the atmosphere) and international credits to be used for compliance with the target. The overall EU-15 target under the Protocol is 8%, but the member countries have agreed on a burden-sharing arrangement as shown. Some countries (e.g., France) have a target of 0%, and consequently no bar for their target appears on the graph. Note that emissions from Monaco are included with France. This graph is based on data taken from the International Energy Agency (IEA) publication “CO2 Emissions From Fuel Combustion: Highlights (2011 edition);” publisher: IEA, Paris, France; Page 13. The PDF version (size 1717 KB) is freely available for download. |
| Date | |
| Source | Own work |
| Author | Enescot |
Licensing
I, the copyright holder of this work, hereby publish it under the following licenses:
This file is licensed under the Creative Commons Attribution-Share Alike 3.0 Unported license.
- You are free:
- to share – to copy, distribute and transmit the work
- to remix – to adapt the work
- Under the following conditions:
- attribution – You must give appropriate credit, provide a link to the license, and indicate if changes were made. You may do so in any reasonable manner, but not in any way that suggests the licensor endorses you or your use.
- share alike – If you remix, transform, or build upon the material, you must distribute your contributions under the same or compatible license as the original.

|
Permission is granted to copy, distribute and/or modify this document under the terms of the GNU Free Documentation License, Version 1.2 or any later version published by the Free Software Foundation; with no Invariant Sections, no Front-Cover Texts, and no Back-Cover Texts. A copy of the license is included in the section entitled GNU Free Documentation License. |
You may select the license of your choice.
File history
Click on a date/time to view the file as it appeared at that time.
| Date/Time | Thumbnail | Dimensions | User | Comment | |
|---|---|---|---|---|---|
| current | 13:07, 4 January 2012 | | 894 × 841 (14 KB) | Enescot | Added data labels to bar graph. These labels quantify the Kyoto targets and the observed change in emissions between 1990-2009. Other formatting changes to improve readability of the added labels. |
| 14:08, 7 December 2011 |  | 887 × 755 (13 KB) | Enescot | {{Information |Description ={{en|1=This bar graph shows Kyoto Parties with first period (2008-2012) greenhouse gas emissions limitations targets and the percentage change in their carbon dioxide emissions from fuel combustion between 1990 and 2009. The |
File usage
The following pages on the English Wikipedia use this file (pages on other projects are not listed):
Global file usage
The following other wikis use this file:
- Usage on ig.wikipedia.org
- Usage on vi.wikipedia.org
_greenhouse_gas_emissions_limitations_targets_and_the_percentage_change_in_their_carbon_dioxide_emissions_from_fuel_combustion_between_1990_and_2009.png)